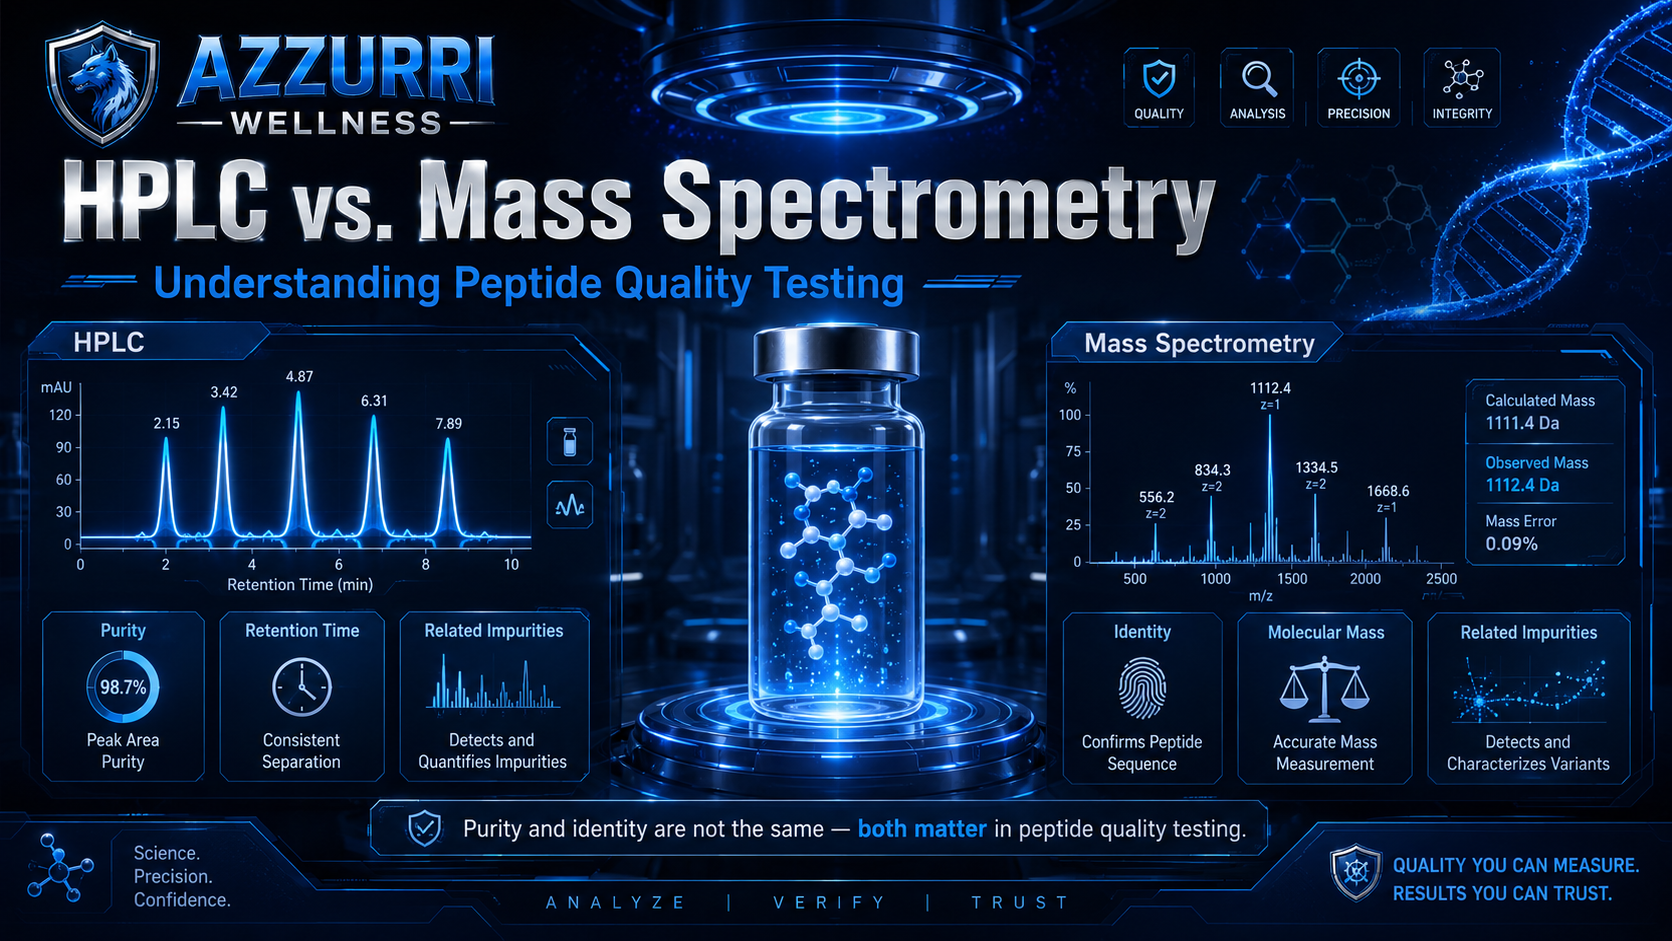
When reviewing peptide documentation, two analytical terms appear repeatedly: HPLC and mass spectrometry. They are often displayed together on a Certificate of Analysis, but they do not measure the same thing.
In simple terms, high-performance liquid chromatography, or HPLC, helps determine what components are present in a sample and how well they can be separated. Mass spectrometry helps determine the molecular mass and structural identity of those components.
Neither method provides a complete quality assessment by itself. A strong analytical evaluation uses complementary techniques because peptide quality involves more than one question:
- Is the intended peptide present?
- Does its molecular mass match the expected structure?
- How much related impurity is present?
- Are different substances hidden beneath one chromatographic peak?
- How much actual peptide is present in the vial?
- Are water, salts, solvents, counterions, or other materials contributing to the sample's total mass?
Research into synthetic peptide characterization consistently shows that chromatography and mass spectrometry are most informative when used together.
HPLC and Mass Spectrometry Answer Different Questions
| Test | Primary purpose | Typical information |
|---|---|---|
| HPLC | Separates sample components | Peaks, retention times, peak areas and impurity profile |
| Mass spectrometry | Measures mass-to-charge ratios | Expected molecular mass, charge states and possible impurity masses |
| LC–MS | Combines separation and mass analysis | Links chromatographic peaks to molecular-mass information |
| MS/MS | Fragments selected ions | Provides stronger structural or sequence evidence |
HPLC is therefore most useful for understanding the sample's chromatographic profile, while mass spectrometry is particularly useful for confirming molecular identity and characterizing related impurities.
What Does HPLC Measure?
HPLC separates compounds as they pass through a column. Each compound interacts differently with the column material and the moving solvent, causing different substances to exit the column at different times.
For peptide analysis, reversed-phase HPLC is commonly used. Peptides and related impurities may be separated according to differences in hydrophobic interaction, although the outcome also depends on the column, solvent gradient, temperature, flow rate, additives and other method conditions.
The resulting HPLC chromatogram usually contains:
- A major peak representing the principal detected component
- Smaller peaks that may represent related impurities or degradation products
- A retention time for each resolved peak
- An integrated peak area
- An estimated area percentage for each peak
Chromatography is valuable because peptide synthesis can create deletion sequences, truncated products, incomplete coupling products, oxidized forms and other closely related compounds. However, some impurities can be difficult to separate because their chemical structures may be extremely similar to the target peptide.
What Is Retention Time?
Retention time is the period between sample injection and the detection of a specific compound as it exits the HPLC column.
When a validated method and suitable reference material are used, a matching retention time can support identification. However, retention time is not a universal fingerprint. It can change when analytical conditions change, including:
- Column chemistry
- Column dimensions
- Solvent composition
- Gradient profile
- Flow rate
- Temperature
- Sample matrix
- Mobile-phase additives
Two different substances may sometimes have similar retention times, while the same peptide may show a different retention time under a different method.
For this reason, retention time should generally be interpreted as supporting evidence, not definitive proof of identity. Linking a retention-time peak to its molecular mass through LC–MS provides much stronger evidence. The scientific literature on synthetic peptide analysis emphasizes the need to understand method limitations, coelution and other potential LC–MS pitfalls.
How Is an HPLC Purity Percentage Calculated?
Many peptide reports provide a value such as HPLC purity: 98.7%.
This commonly refers to the proportion of the total detected chromatographic peak area assigned to the main peak under a particular analytical method. For example, when the main peak represents 98.7% of the integrated detected area, the sample may be reported as 98.7% pure by HPLC area normalization.
That result can be useful, but it is important to describe it accurately:
- It is a relative chromatographic result under the conditions of that specific method.
- It does not necessarily mean that 98.7% of the complete material inside the vial is active or intact peptide by total weight.
HPLC area calculations can be affected by coelution, detector response, integration settings, compounds that absorb differently, and substances that are not effectively detected by the selected detector. Peptide-content studies have therefore used additional techniques such as amino-acid analysis, quantitative NMR, elemental approaches and calibrated assays when assigning absolute peptide content.
What Does Mass Spectrometry Confirm?
Mass spectrometry measures the mass-to-charge ratio, written as m/z, of ionized molecules.
Because peptides can carry one or multiple electrical charges, one peptide may produce several related signals. Analytical software can evaluate these charge states and calculate the corresponding neutral molecular mass.
When the measured mass agrees with the peptide's calculated theoretical mass within the method's accepted tolerance, the result supports the conclusion that the expected molecular species is present.
Mass spectrometry may therefore provide information about:
- Observed molecular mass
- Expected versus measured mass
- Charge states
- Isotopic pattern
- Oxidized or modified forms
- Truncated sequences
- Deletion products
- Addition products
- Degradation products
- Other structurally related impurities
Protocols using LC–MS and MALDI-TOF mass spectrometry have specifically been described for confirming the identity and assessing the purity of synthetic peptides.
What Is Molecular Mass?
The expected molecular mass of a peptide is calculated from its amino-acid sequence and any known modifications, such as:
- Amidation
- Acetylation
- Disulfide formation
- Lipid attachment
- Added chemical groups
- Salt or counterion form
The mass spectrometer produces an observed result that can be compared with the theoretical value.
A close match provides important identity evidence, but a matching intact mass does not always establish every structural detail. Some isomers, stereochemical variants or sequence-related structures can have the same or nearly the same mass.
Specialized chromatographic and tandem-mass-spectrometry methods may be required to detect low-level D-amino-acid or isomeric peptide impurities. Studies involving a GLP-1 peptide and other synthetic peptides have demonstrated the need for chiral or higher-resolution approaches when ordinary intact-mass measurements are insufficient.
What Is Tandem Mass Spectrometry?
In tandem mass spectrometry, frequently written as MS/MS, a selected peptide ion is fragmented into smaller pieces.
The resulting fragment pattern can provide stronger evidence about:
- Amino-acid sequence
- Location of a modification
- Location of a missing residue
- Structure of a related impurity
- Whether a peak contains the target peptide or another compound
An intact molecular mass answers, "Does this molecule have approximately the expected total mass?" MS/MS goes further by asking, "Do the molecular fragments support the expected structure or sequence?"
For difficult impurity investigations, researchers frequently combine liquid-chromatographic separation, high-resolution mass spectrometry and MS/MS fragmentation.
Peptide Purity and Peptide Identity Are Not the Same
This distinction is one of the most important principles in peptide quality testing.
Purity asks: how much of the detected sample appears to be the principal component compared with other detected components?
Identity asks: is that principal component actually the peptide it is claimed to be?
A chromatogram could theoretically show one dominant peak, but that dominant peak might not be the intended peptide. Conversely, a mass spectrum might confirm that the expected peptide is present but provide insufficient information about how much impurity is also present.
Published quality-control investigations demonstrate why both questions matter. In one investigation of commercially obtained synthetic peptides, one sample was found to contain an entirely different peptide, while several others did not meet the researchers' selected purity requirements.
Another evaluation of synthetic quorum-sensing peptides reported that only 44% of the samples met the study's required purity criteria, while one sample's main component had a different structure from the intended peptide.
These findings do not mean that all commercially produced peptides have quality problems. They demonstrate why neither a product label nor one isolated analytical number should replace a complete, batch-specific evaluation.
What Are Related Peptide Impurities?
Related impurities are molecules structurally similar to the intended peptide. They may originate from:
- Incomplete amino-acid coupling
- Missing amino acids
- Additional amino acids
- Truncation
- Sequence deletion
- Oxidation
- Deamidation
- Hydrolysis
- Racemization
- Side-chain reactions
- Cleavage or purification conditions
- Storage-related degradation
These substances can be analytically challenging because they may have chemical properties similar to the intended peptide.
In a detailed investigation of synthetic human C-peptide, researchers used LC–high-resolution MS to identify and quantify more than 65 structurally related impurities in the study material. This illustrates how complex an impurity profile can become even when a chromatogram appears to contain one predominant component.
Why a High HPLC Purity Result Is Not the Complete Answer
A reported HPLC purity result may not reveal:
- Whether the main peak has the correct identity. A large peak only shows that one detected component dominates the chromatogram. Mass or structural confirmation is still needed.
- Whether another compound is coeluting. Two substances may exit the column at nearly the same time and appear as one unresolved peak.
- The exact amount of peptide by total vial mass. Water, salts, counterions, residual solvents and other non-peptide materials may contribute to the product's total weight.
- Whether all substances have equal detector response. Peak area does not automatically equal mass fraction. Different substances may produce different detector responses.
- Whether stereochemical impurities are present. D-amino-acid variants can require specialized chiral separation or targeted analytical methods.
- Whether the sample is stable over time. A test result describes the tested sample under specific conditions and at a specific time. Stability requires appropriate time-point and storage-condition studies.
Research on peptide quantification and reference-standard assignment supports the use of multiple, orthogonal analytical methods rather than relying on one HPLC percentage.
What Should Strong Peptide Documentation Include?
The appropriate testing package depends on the peptide, its application and the applicable quality requirements. However, a transparent analytical record may include:
- Product name and sequence
- Batch or lot number
- Date of analysis
- HPLC chromatogram
- HPLC method conditions
- Main-peak retention time
- Peak-area table
- Reported chromatographic purity
- Mass spectrum
- Theoretical molecular mass
- Observed molecular mass
- Mass tolerance or error
- LC–MS or MS/MS impurity information when appropriate
- Water or moisture measurement
- Counterion or salt information
- Residual-solvent testing
- Net peptide-content or assay result
- Storage and stability information
- Testing-laboratory identification
Work on synthetic-peptide reference standards emphasizes that identity, impurities and content are separate analytical characteristics that may require chromatography, mass spectrometry, NMR, content measurements and other complementary methods.
HPLC vs. Mass Spectrometry: Which Is More Important?
The most accurate answer is that they are complementary rather than competing technologies.
HPLC is highly useful for separating and estimating the relative distribution of detectable components. Mass spectrometry is highly useful for confirming molecular mass and characterizing the structures associated with those components.
When combined as LC–MS, the analyst can investigate both when a component exits the chromatography column, and what molecular mass is associated with that component.
A credible peptide assessment therefore should not be reduced to a single purity percentage. Quality is better understood through a collection of results that address identity, impurity profile, content and method suitability.
The Azzurri Wellness Perspective
Scientific transparency begins with understanding what a test can — and cannot — prove.
A chromatographic purity percentage can provide valuable information about the detected impurity profile. A mass spectrum can provide valuable evidence of molecular identity. Neither result alone establishes every aspect of peptide quality.
The strongest approach is to review analytical results together, confirm that they apply to the specific batch, and avoid interpreting one number as a complete guarantee.
Precision is not just a percentage. It is a combination of identity, purity, traceability and transparent analytical evidence.